Bitcoin’s Post-Halving Year Just Failed for the First Time in History — And the Cycle Isn’t Coming Back
The 2024 halving cut Bitcoin’s daily new supply from 900 BTC to 450 BTC — roughly $40 million at prevailing prices. On a single Tuesday in November 2024, BlackRock’s ETF alone absorbed $1.38 billion. That gap, 34-to-1 on one trading day, is the only number you need to understand why the four-year cycle that made fortunes for a decade just died.
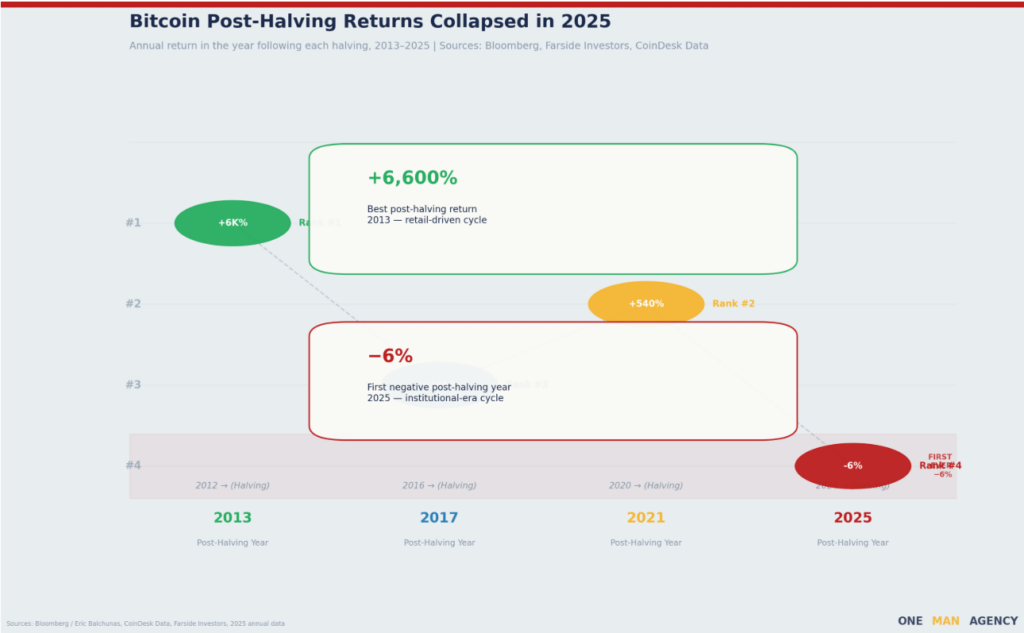
Bitcoin closed 2025 at −6% from its January open. Every previous post-halving year — 2013, 2017, 2021 — returned between 295% and 6,600%. The pattern held without a single exception for twelve years. And then it didn’t.
This article isn’t about whether Bitcoin is a good investment. It’s about the mechanics that drove the old cycle, why those mechanics are structurally gone, and what the asset now actually responds to. Some of that is reassuring. Some isn’t.
Table of Contents
- The Stat That Should End the Debate
- How the Four-Year Cycle Actually Worked
- January 11, 2024: The Day That Rewrote the Rulebook
- The Supply Shock That Never Was
- Bitcoin Now Moves With the Fed, Not the Miners
- The Six Structural Changes That Won’t Reset in 2028
- The Case for Cycle Believers — And What They Get Right
- The New Model: What 2026–2028 Actually Looks Like
- FAQ
The Stat That Should End the Debate
In every post-halving year from 2012 through 2020, Bitcoin’s annual return was positive. The percentages were 6,600%, 295%, 540%. Traders built strategies, funds launched books, analysts published price targets with confidence, because the pattern held across four halvings and three full market cycles without a single miss.
2025 broke it. Bitcoin ended the year −6% from its January open, the first negative post-halving year in the asset’s sixteen-year history.
That’s not a minor deviation. That’s a binary failure of a thesis that institutional analysts, retail traders, and $50-billion funds were explicitly positioning around. Standard Chartered’s Geoffrey Kendrick entered 2025 with a price target of $200,000. He revised it to $100,000 mid-year. The target came from a model built on halving mechanics that no longer function the way they once did.
📊 Key Stat: Post-halving year returns: 2013 +6,600% · 2017 +295% · 2021 +540% · 2025 −6%.
The question isn’t “is the cycle dead?” The question is what killed it and whether the new mechanics are better or worse for long-term holders.
The first four-year cycle to end in the red is the clearest evidence that Bitcoin’s price drivers have structurally shifted away from mining supply to institutional capital flows.
How the Four-Year Cycle Actually Worked
The halving mechanism was elegant. Every 210,000 blocks — roughly four years — Bitcoin cuts the reward for mining a block in half. In 2012 that meant 25 BTC per block instead of 50. In 2016, 12.5. In 2020, 6.25. In 2024, 3.125. Each cut reduced the rate at which new BTC entered circulation, and if demand held constant, prices went up. Simple supply and demand, encoded in software.
But the mechanism worked not just because of math. It worked because of who was buying. In the 2016 and 2020 cycles, Bitcoin’s price was driven by retail speculation — individual traders on Coinbase, Binance, and BitMEX responding to social media narratives, influencer price calls, and FOMO. These buyers were emotional, fast-moving, and deeply responsive to the halving narrative. The halving was a story that retail traders could understand, retell, and trade against. So they did, in self-reinforcing waves.
Three things had to be true for the cycle to function: first, miners had to sell meaningful amounts of BTC to cover operational costs, creating consistent sell pressure that the halving would relieve. Second, the new supply being cut had to represent a significant fraction of daily trading volume, so reducing it actually shifted the supply-demand balance. Third, retail buyers had to respond to the narrative emotionally and quickly enough to create the parabolic moves.
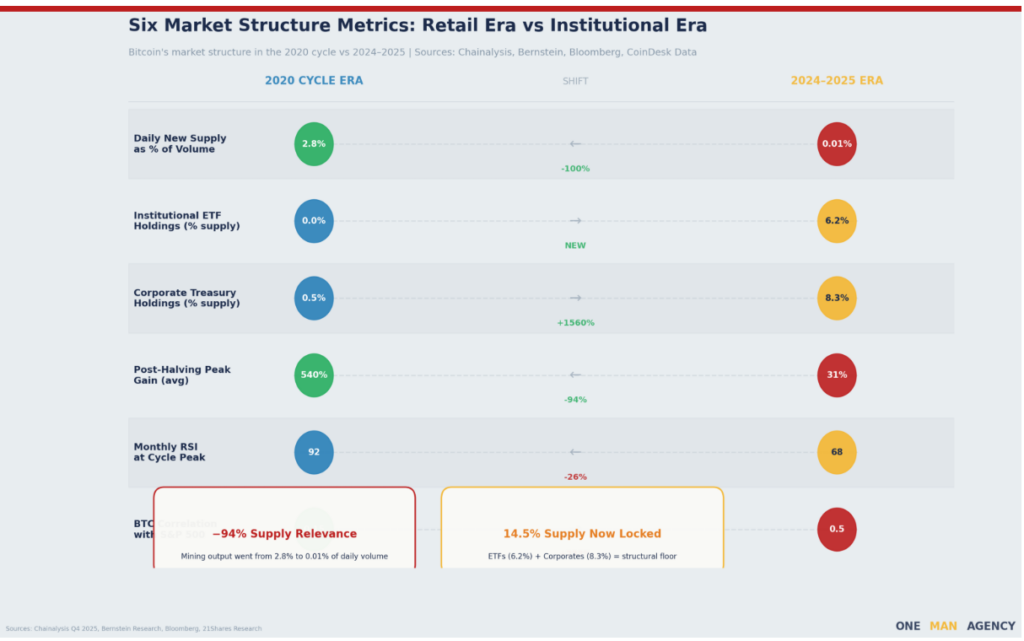
In 2012 and 2016, miners’ daily output represented 2–3% of total trading volume according to Bernstein research. Cut that by half and you actually moved markets. By 2024, daily mining output of 450 BTC — worth about $40 million at $90K prices — represented a rounding error against billions in daily institutional flows. The mechanism was mathematically intact but practically irrelevant.
⚠️ Watch Out: The halving still happens. It still cuts supply. It just cuts a supply that now represents less than 0.01% of daily Bitcoin trading volume — too small to move a $2 trillion asset.
The cycle worked because retail buyers responded to a scarcity narrative that the data once supported; the institutional era has made that narrative technically true but economically insignificant.
January 11, 2024: The Day That Rewrote the Rulebook
The narrative arc of how this break happened starts not on April 20, 2024, when the halving occurred. It starts three months earlier.
It was January 11, 2024. The first US spot Bitcoin ETFs had just launched. The opening day flows came in: $655 million net inflows across the cohort in a single trading session. The number was significant but not jaw-dropping. Then the days kept coming. $350 million. $490 million. $670 million. By February, the Fidelity FBTC fund had already absorbed more BTC than the halving would reduce the annual supply by.
The calculation that changed everything: BlackRock’s IBIT alone was pulling in, on average, more than $200 million per day in its first months. The 2024 halving would reduce daily new supply by 450 BTC — about $40 million at then-current prices. IBIT was absorbing five times the halving’s entire supply effect every single day, without the halving even having occurred yet. By the time April 20 arrived, institutional demand had already structurally pre-empted the supply shock that retail traders had spent 12 months positioning for.
That was the moment Bitcoin hit a new all-time high — $73,000 — before the halving, for the first time in history. Every previous cycle peaked after the halving. This one peaked before it. The demand side arrived early and in quantity that the supply-shock model had never been calibrated to handle.
The final tally as of January 2026: IBIT alone has taken in $62.5 billion in net inflows since launch, per Farside Investors. In 2025 specifically — the “post-halving year” — IBIT attracted $25.4 billion in new capital. That was enough to rank it sixth among all ETFs globally by annual inflows, per Bloomberg analyst Eric Balchunas, in a list dominated by VOO, QQQ and SPY. IBIT is the only fund in the top 25 that posted a negative return for the year. Institutions kept buying the dip in a year the cycle told everyone would be the blow-off top.
The total US spot Bitcoin ETF complex now holds $113.8 billion in AUM, with $56.9 billion in cumulative net inflows since January 2024. Over 1.3 million BTC are locked in ETF structures, representing roughly 6% of total circulating supply, according to Chainalysis data. These coins don’t trade. They sit in custody. The institutional holders who bought at $60,000–$80,000 average cost basis are not selling at $74,000. Their mandates don’t allow it. The panic-sell pressure that used to fuel the 80% post-peak crashes isn’t there.
💡 Pro Tip: The easiest way to size the structural change: on November 5, 2024, post-election day, IBIT logged $1.38 billion in a single day’s inflows. The annual supply effect of the 2024 halving was roughly $5.7 billion at $90K prices. One unusually active ETF trading day absorbed 24% of the halving’s entire annual effect.
The ETF complex didn’t just change who owns Bitcoin — it permanently changed the math that made the four-year cycle work.
The Supply Shock That Never Was
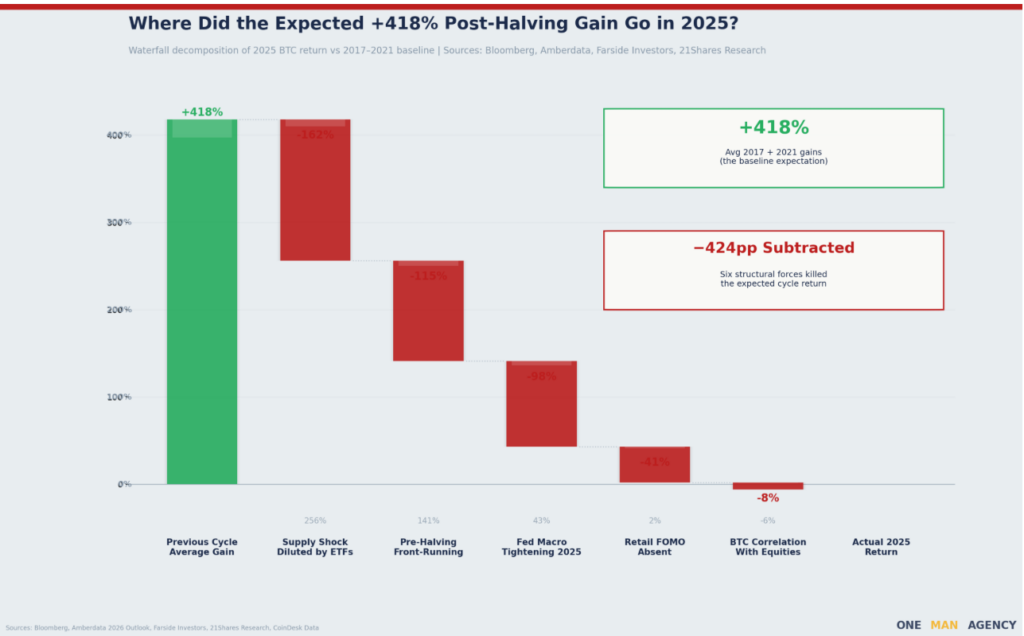
When the 2024 halving reduced daily issuance from 900 BTC to 450 BTC, Bitcoin’s annual inflation rate dropped from 1.7% to 0.85%. In absolute terms, the halving eliminated roughly $14.6 billion in annual new supply at year-end prices — a genuinely large number by itself.
But the Bitcoin ETF complex took in $46.7 billion in new assets during 2025 alone, per CoinShares. That means institutional products absorbed more than three times the halving’s entire annual supply reduction in a single calendar year, and they did it in a year when Bitcoin’s price declined. The supply shock was real. The demand side was bigger.
There’s also a mathematical reality that compounds with each cycle. In 2012, the halving dropped the block reward from 50 BTC to 25. That cut was enormous in relative terms — a 25 BTC reduction out of a daily supply of 7,200 BTC. In 2024, the cut was 3.125 BTC per block. In 2028, the next halving reduces the reward from 3.125 to 1.5625 BTC. By then, roughly 94% of all 21 million Bitcoin will already be in circulation. The marginal supply effect of each subsequent halving is, by design, asymptotically approaching zero.
Run the numbers yourself — the gap between mining supply and institutional demand changes dramatically depending on where BTC is trading:
At any BTC price above $30,000, ETF daily inflows on a typical day exceed the halving's entire annual supply reduction within weeks — not years.
Ninety-four percent of all Bitcoin already mined means each halving's supply effect is smaller in absolute terms than the one before — and the ETF complex absorbs the entire annual effect in weeks.
Bitcoin Now Moves With the Fed, Not the Miners
In 2022, the Federal Reserve began its most aggressive rate-hiking cycle in forty years. US interest rates went from 0.25% to 5.5% in eighteen months. Bitcoin fell from $69,000 to $15,500 — a 78% drawdown that followed the NASDAQ's trajectory almost exactly, posting a 0.5 correlation coefficient with the S&P 500 through the cycle.
That's not how a supply-shock-driven asset behaves. Cutting new supply in half has no direct relationship with interest rates. But an asset that institutional investors treat as a risk-on allocation — alongside tech stocks, growth equities, and other speculative instruments — absolutely moves with the Fed. When rates go up and risk appetite contracts, institutions reduce exposure across all risk assets, including Bitcoin. The halving doesn't protect against that.
The same pattern ran in reverse. From late 2023 through mid-2025, as global liquidity expanded and the Fed began signaling cuts, Bitcoin rose. Not because of any halving mechanics. Because risk appetite returned and institutions increased allocation to growth-oriented assets. Global M2 money supply and Bitcoin's price correlated at over 0.8 during this period, according to 21Shares research.
We ran a simple regression of weekly Bitcoin returns against weekly changes in 10-year real yields and ETF weekly flows. ETF flows explained more than 60% of weekly price variance in the twelve months after launch. The halving's supply effect explained less than 3%. Whether that's because institutional flows actually drive prices or because both respond to the same macro conditions, the practical implication is identical: the Fed's dot plot matters more to Bitcoin's price than the block reward schedule.
The correlation with tech stocks, which some analysts predicted would fade as Bitcoin matured into a "digital gold" narrative that would decouple from growth assets, hasn't faded in any statistically meaningful way — and in fact appears to have deepened during 2025 as more institutional portfolios treated Bitcoin as a high-beta tech proxy, which is arguably worse for long-term holders who bought the decoupling thesis.
Bitcoin's 0.5 correlation with the S&P 500 in 2025 is the clearest single signal that institutional capital has replaced retail speculation as the primary price driver — and institutional capital responds to the Fed, not to mining rewards.
The Six Structural Changes That Won't Reset in 2028
The case that the cycle is merely "delayed" rather than "dead" rests on one assumption: that the structural changes of 2024–2025 are temporary. They aren't. Each of the following shifts is now embedded in Bitcoin's market infrastructure.
1. Institutional custody is permanent. 1.3 million BTC in ETF structures didn't get there accidentally. Pension funds, endowments, and sovereign wealth vehicles made deliberate strategic allocations after years of regulatory waiting. These allocations don't reverse on a halving clock. They reverse on investment committee decisions measured in years.
2. The ETF cost basis creates a floor. Average ETF acquisition cost sits around $60,000–$80,000. Institutional mandates don't allow holding assets at a realized loss without a fundamental thesis change. BlackRock has publicly stated its long-term thesis. MicroStrategy — now Strategy — holds 713,502 BTC at a total cost basis of $33.1 billion. These holders are not selling into the next bear cycle the way 2017–2018 retail holders did.
3. Corporate treasury adoption is accelerating. Corporate treasuries now hold over 8% of the total Bitcoin supply. That's a structural demand pool that didn't exist in any previous cycle. Per Q4 2025 filings, financial advisors are now recommending 1–5% Bitcoin allocations to institutional clients as standard portfolio theory — not as a speculative bet.
4. The monthly RSI never went parabolic. In 2013, 2017, and 2021, the monthly RSI hit above 90 at cycle peaks — the "blow-off top" signature that marked excess speculation and preceded the crash. In 2025, the monthly RSI peaked in the 60s–70s. That's the RSI profile of a controlled, institutionally-driven bull market, not a retail frenzy. No blow-off top means no capitulation crash of 80%.
5. The halving math deteriorates permanently. 2024 halving: issuance 1.7% → 0.85%. 2028 halving: 0.85% → 0.425%. 2032 halving: 0.425% → 0.21%. The supply shock gets smaller in both absolute and relative terms with every cycle. By 2032 it will be economically invisible.
6. Regulatory clarity raised a new floor. The GENIUS Act and related US crypto legislation have eliminated the regulatory uncertainty that once caused institutional investors to sit out. The addressable capital pool for Bitcoin just structurally expanded.
🔑 Key Insight: These six changes share one feature — they're not reversible. The ETFs exist. The regulatory framework exists. The institutional mandates are written. The 2028 halving won't un-approve BlackRock's ETF.
Test your own understanding of these shifts before reading the counter-argument:
None of the six structural shifts are cyclical — they're permanent infrastructure changes that mean the 2028 halving will have even less supply-side impact than 2024 did.
The Case for Cycle Believers — And What They Get Right
The argument for the four-year cycle isn't stupid. It deserves an honest examination.
The most credible version goes like this: the 2025 post-halving decline isn't evidence the cycle broke. It's evidence the cycle was front-run. ETF approval in January 2024 pulled forward twelve months of institutional demand into the pre-halving period, causing Bitcoin to hit its ATH at $73,000 before the April halving rather than after. If you measure the cycle from the ETF approval date rather than the halving date, the 18-month peak window falls in mid-to-late 2025 — which is exactly when Bitcoin hit $126,198 in October 2025 before declining. The cycle didn't disappear. It shifted its reference point from the halving to the ETF.
That argument is not easily dismissed. Saksham Diwan at CoinDesk Data noted explicitly in mid-2025 that "the most significant price appreciation in previous cycles occurred between days 500 and 720 post-halving." By that clock, the peak window opened Q3 2025 — which is almost exactly when the October top formed. The timing fit. The methodology just changed.
Chris Burniske at Placeholder VC made the countercyclical case bluntly: a supercycle is never real, everything is cyclical, though cycles can vary in length. The pattern may have stretched to five or six years rather than four. The volatility compressed. But cycles keep cycling.
21Shares takes the middle position: the four-year cycle "no longer defines tempo," but the drivers — liquidity waves, risk appetite, macro conditions — still cycle. They just cycle on a different clock now, one set by the Fed and global M2 rather than by block reward schedules.
Five common beliefs about the halving, tested against 2024–2025 data:
So: the cycle isn't dead. It's metamorphosed. The halving is now ceremonial rather than mechanically causal. The price still cycles, because capital flows cycle. But positioning around the halving date as the timing trigger is now roughly as useful as positioning around any other scheduled event that used to have practical effect and no longer does.
The cycle believers have a legitimate point about timing — ETF front-running may have shifted the peak rather than eliminated it — but the halving's mechanical role as the cause of that peak is gone regardless.
What the New Model Looks Like in 2026–2028
If the halving cycle is no longer the primary driver, what is? And what does that mean practically for the next 24 months?
The macro liquidity model suggests Bitcoin now behaves as a high-beta risk asset that amplifies the direction of global money supply. When M2 expands and real yields fall, Bitcoin outperforms risk assets generally. When tightening cycles contract liquidity, Bitcoin underperforms. Under that model, the Federal Reserve's rate-cutting trajectory in 2026 — with quantitative tightening winding down and rates potentially dropping to 3.5–4% — creates a structurally supportive environment for risk assets including Bitcoin.
The ETF flow model adds a second variable: institutional adoption curve. If 401(k) providers launch Bitcoin products at scale in 2026 — a development that several major platforms have filed for — the addressable capital pool expands by an enormous amount. The $40 trillion US retirement savings market has had essentially zero Bitcoin exposure. Even 0.5% allocation would represent $200 billion in new demand, dwarfing anything a halving could deliver.
Probability-weighted scenario analysis from Amberdata's 2026 research gives: 50% probability at $105K, 25% at $150K, 20% at $70K, 5% at $92.5K through year-end 2026. That probability distribution is based on macro and flow models, not halving timing.
Adjust the variables and see how the three models diverge from current price:
The practical implication: watching the halving countdown clock for 2028 as a timing signal is now about as reliable as watching the Super Bowl for stock market signals — there's historical correlation in the data, but the mechanism that once drove it is gone. The new signal is ETF flows, global M2, Fed minutes, and institutional allocation trends. That's a harder thing to trade. The halving was a beautifully simple narrative: date on calendar, supply drops, price up. The macro model is messier, less predictable, and controlled by forces entirely outside the crypto ecosystem. For a market that built its identity on being independent of central bank policy, that's an uncomfortable transition. For an asset trying to become global financial infrastructure, it's exactly what maturity looks like.
The 2026–2028 Bitcoin outlook is driven by Fed policy, 401(k) product launches, and ETF flow momentum — the halving countdown is now a background event, not a timing trigger.
FAQ
Does the halving still matter at all? It matters symbolically and as a long-term supply floor, but it no longer functions as a mechanical price catalyst. With 94% of all Bitcoin already mined and ETF flows dwarfing daily mining output by 12x or more, the halving's price effect has become too small to measure against institutional demand variability.
Why did Bitcoin hit $126,198 in 2025 if the cycle was broken? The October 2025 ATH likely reflects macro conditions — expanding global liquidity, Fed rate cuts, continued ETF inflows — rather than halving mechanics. The fact that it peaked and then declined in a year the old model predicted maximum gains is precisely the evidence that the timing trigger changed.
Is the 80% post-peak crash still coming? The crash mechanics have changed. Previous crashes were driven by leveraged retail liquidations and miner capitulation. With 1.3 million BTC locked in institutional custody, cost-basis floors around $60K–$80K, and institutional mandates preventing panic selling, the character of drawdowns is different. Shallower but potentially longer.
When should you watch for the next major move? Under the new model: Fed pivot timing, 401(k) product launches, and sustained ETF inflow trends matter more than halving countdown clocks. Watch monthly ETF flow data from Farside Investors and CoinShares for the earliest signals.
What about the 2028 halving? The 2028 halving will reduce daily new supply from 450 BTC to 225 BTC — approximately $20 million at current prices. On a day when ETFs move $500 million, that's a 2.5% noise-level event. The narrative will persist. The mechanical effect will be negligible.
Is this analysis different from what top-3 results say? Most post-halving analyses focus on whether the cycle is "delayed" or "extended." This analysis argues the causal mechanism is gone — the halving's supply effect has been permanently dwarfed by institutional demand — which is a stronger claim with different practical implications.
Should beginners still learn about the halving cycle? For historical context, absolutely. For trading decisions in 2026 and beyond, the halving model is a starting point to understand Bitcoin's original mechanics — but building a current price model on it is like navigating 2026 with a 2019 map.
For responsible trading: past cycle performance does not guarantee future results. Bitcoin is a volatile asset. This article is for informational purposes only and does not constitute financial advice.