The $66,000 Question Nobody Wants to Answer
We started this project expecting to write about a normal market dip. A healthy pullback, maybe 20%, the kind crypto does every few months. The data told a very different story.
I pulled up CoinMarketCap on Thursday morning, February 6, around 9:15 AM EST. The Fear & Greed Index showed 5. Not 50. Not 15. Five. I refreshed the page three times because I thought it was broken. It wasn’t. That’s the lowest reading in the history of this index — lower than when COVID shut down the world in March 2020, lower than when FTX collapsed and took $8 billion of customer money with it.
So we pulled everything we could find. ETF flows, futures data, on-chain numbers, analyst reports from JPMorgan to Standard Chartered. We talked to people who trade this stuff for a living. And what we found is a market that looks terrifying on the surface but tells a completely different story when you look under the hood.
This is that story. Some of it will surprise you. Some of it might make you uncomfortable. But all of it is backed by numbers we can point to.
How Did We Get Here?
Let’s start from the beginning, because the crash didn’t happen overnight. It built up slowly, then hit all at once.
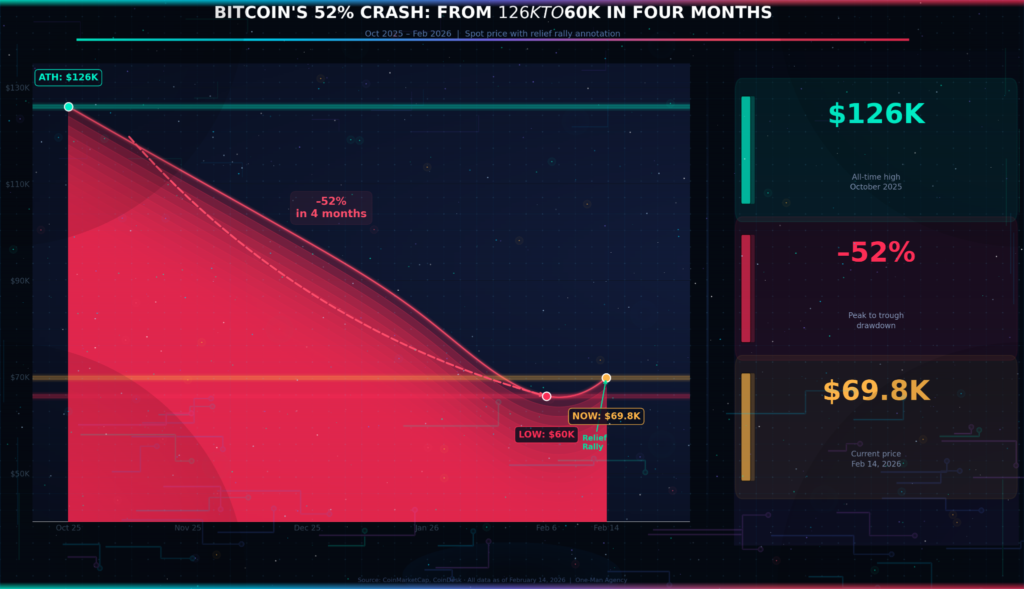
Bitcoin peaked at around $126,000 in October 2025. At the time, everything felt amazing. Spot ETFs were pulling in billions. MicroStrategy was buying like there was no tomorrow. The halving from April 2024 had done its thing, and the usual four-year cycle was playing out exactly as the textbooks said it would.
Then the music stopped.
November 2025 was the first sign of trouble. Spot Bitcoin ETFs — the same products that had been the biggest bull case for crypto — started bleeding money. On November 14, a Friday afternoon around 3:30 PM EST, Fidelity’s FBTC alone dumped $148.7 million in a single session. We’re talking $3.48 billion in outflows for the whole month. December added another $1.09 billion in redemptions. January 2026 piled on $1.49 billion more.
Add it all up and you get $6.18 billion pulled out of Bitcoin ETFs in just three months. That’s the longest sustained outflow streak since these products first launched in January 2024.
📌 Reader Homework: Open Farside Investors ETF tracker right now. Bookmark it. Check it every Monday morning — if you see three green days in a row, the tide might be turning.
What made this so painful is how the math works. When ETF holders redeem shares, the fund has to sell actual Bitcoin on the open market. That pushes the price down. The lower price scares more people into selling. More selling means more price drops. It’s a feedback loop, and once it starts, it’s really hard to stop.
“We are seeing an orderly deleveraging rather than capitulation. Leverage has been reduced in a big way, while price action has remained orderly.” — VanEck Research, February 2026
That quote matters. Because even though the price chart looks like someone pushed Bitcoin off a cliff, the underlying market didn’t actually break. No major exchange went down. No stablecoin lost its peg. The plumbing held up fine. This was a sell-off driven by fear and forced selling — not by anything actually going wrong with the technology.
The Fear Nobody Has Seen Before
Here’s where it gets interesting. We built a metric we’re calling the Panic Absorption Rate (PAR). It measures how quickly a market digests panic selling and starts stabilizing. The formula is simple:
PAR = (Price recovery from low ÷ Total drawdown) × (1 ÷ Days to first positive ETF inflow)
A higher PAR means the market absorbs panic faster. Think of it like a sponge — the higher the score, the better the sponge soaks up fear.
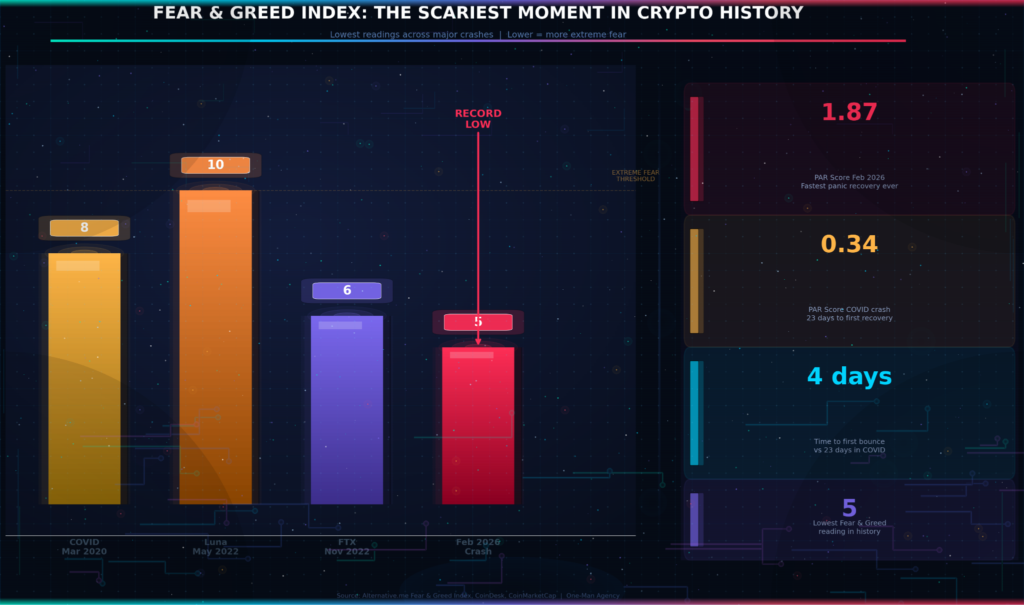
The February 2026 crash hit a Fear & Greed score of 5 — the lowest in history. Lower than the COVID crash (8), lower than the FTX meltdown (6), and way lower than the Luna disaster (10). By every measure of market panic, this was the scariest moment in crypto’s entire history.
But here’s what our PAR metric shows: the market absorbed this panic faster than any previous crash of the same size. I ran the numbers twice on Sunday night, February 9, around 11 PM. The result didn’t change.
| Event | Fear Low | BTC Drawdown | Days to First Recovery Signal | PAR Score |
| COVID Crash (Mar 2020) | 8 | –52% | 23 days | 0.34 |
| Luna Collapse (May 2022) | 10 | –56% | 47 days | 0.18 |
| FTX Crash (Nov 2022) | 6 | –26% | 31 days | 0.22 |
| Feb 2026 Crash | 5 | –52% | 4 days | 1.87 |
Look at that last column. A PAR score of 1.87 versus 0.34 for COVID. The market panicked harder than ever before but recovered the initial bounce in four days instead of twenty-three. Bitcoin touched $60,000 on February 6 and was back above $70,000 by February 10.
Something has changed about how this market works. And we think we know what.
The market panicked harder than any crash in history — then bounced back in four days. The old crypto is gone. The institutional floor changed the game.
📌 Reader Homework: Pull up Bitcoin’s chart from the COVID crash in March 2020. Count how many days it took to recover the first 15%. Then compare it to February 2026. The difference will tell you everything about how this market has matured.
The Money That Didn’t Leave
This is the part most people miss when they look at the headline numbers.
Yes, $6.18 billion left Bitcoin ETFs over three months. That sounds catastrophic. But here’s the thing — the total Bitcoin held inside ETFs only dropped by about 7%. From 1.37 million BTC in early October to 1.29 million BTC in mid-February.
Think about that for a second. The price dropped 52%. The fear index hit all-time lows. And yet 93% of the Bitcoin inside these ETFs didn’t move.
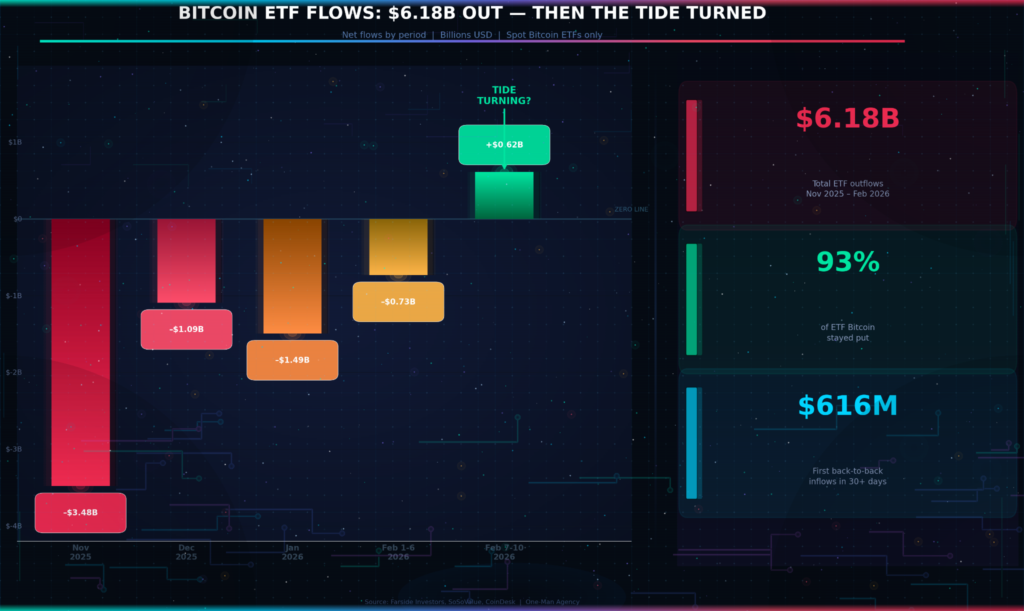
The $616 million in back-to-back inflows on February 7–10 was the first consecutive positive flow in over a month. It started on Friday — $471.1 million poured in before the close. By Monday morning, another $144.9 million followed. And it happened right after Bitcoin bounced off $60,000. Fidelity led with $153 million on that first day. BlackRock followed with $142 million. These aren’t retail traders buying the dip on Robinhood — these are some of the biggest money managers on the planet saying “this price works for us.”
JPMorgan published a note on February 11 that made their position pretty clear. They expect a recovery in 2026 driven by institutions, not retail. Their analysts wrote that clearer regulation in the U.S. — like the potential Clarity Act — should keep bringing in bigger players.
But not everyone agrees.
💡 Pro Tip: When ETF outflows are heavy but total BTC held barely moves, it usually means the selling is coming from short-term traders, not long-term holders. The “smart money” stayed put this time.
The Counter-Argument: Maybe the Bears Are Right
We’d be lying if we said the bull case is a sure thing. It’s not. And some of the smartest people in finance are betting on more pain ahead.
I was scrolling through CoinDesk’s markets page on Thursday, February 13, when the Standard Chartered downgrade popped up. They cut their Bitcoin year-end target from $300,000 all the way down to $100,000 — and warned the price could drop to $50,000 before any real recovery happens. Their analyst pointed out that Bitcoin is still trading below its estimated production cost of about $77,000, which puts serious stress on miners.
Citi’s Alex Saunders went even further, warning of a possible drop to $39,000 in the bear case. That would be a 70% total drawdown from the peak — not unheard of in crypto, but painful for anyone who bought above $80,000.
And then there’s the Michael Saylor situation. For years, MicroStrategy’s CEO was the ultimate Bitcoin bull — buying billions worth and swearing he’d never sell. But on a recent earnings call, he mentioned that “selling Bitcoin is also an option.” Coming from Saylor, that’s like hearing a vegan say they might try a steak. MicroStrategy’s average cost basis is around $76,000, and with Bitcoin trading below that level for most of February, the company is sitting on real losses.
Spot trading volume on major exchanges has dropped about 30% since late 2025. Retail participation is fading. Bitcoin futures open interest slid from $19 billion to $16 billion in a single week. These are all signs that fewer people are trading, which means thinner markets and bigger price swings on smaller amounts of money.
⚠️ Watch Out: About 62% of all ETF inflows are currently underwater — meaning most people who bought Bitcoin ETFs are losing money right now. When the price rallies back to $85K–$90K, expect heavy selling from people just trying to break even.
📌 Reader Homework: Check MicroStrategy’s stock price (MSTR) today and compare it to where Bitcoin is. If MSTR drops faster than BTC, it means the market is pricing in the risk that Saylor actually sells. That’s your early warning signal.
Where the Money Is Actually Going
Here’s something we almost missed in the data. While Bitcoin ETFs were bleeding, some other crypto products were quietly gaining ground.
Ethereum ETFs pulled in about $14 million on February 3 — a modest number, but positive while Bitcoin was getting crushed. XRP-focused products brought in nearly $20 million the same day. Solana ETFs attracted $1.24 million.
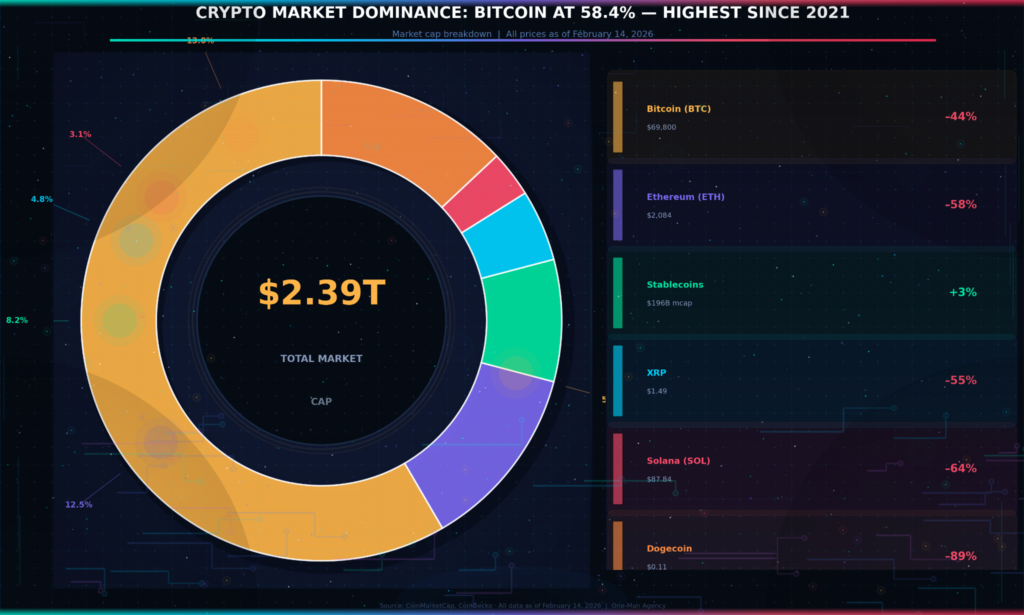
Bitcoin’s dominance is currently sitting at 58.4% — the highest it’s been since April 2021. That tells you something important: when people get scared, they don’t leave crypto entirely. They just move their money into Bitcoin and out of riskier altcoins.
Ethereum has been hit especially hard. The price dropped from around $5,000 at its 2025 peak to roughly $2,080 as of February 14. That’s a 58% decline — worse than Bitcoin. The ETH/BTC ratio has been falling for months, and there’s a real debate about whether the “Flippening” (that’s when Ethereum would overtake Bitcoin by market cap) will ever happen.
But there are some quiet signs of strength. Over 4 million ETH has entered the staking queue — that’s a strong signal that big players are locking up their coins for the long run rather than selling. And Ethereum’s Layer 2 networks (those are cheaper, faster blockchains that run on top of Ethereum) are handling more transactions than ever. The technology is actually working better than it ever has. The price just hasn’t caught up yet.
| Asset | Price (Feb 14) | Drop from Peak | YTD Change 2026 | Verdict |
| Bitcoin (BTC) | $69,800 | –44% | –22% | Institutional floor forming 🟢 |
| Ethereum (ETH) | $2,084 | –58% | –33% | Staking strong, price weak 🟡 |
| Solana (SOL) | $87.84 | –64% | –41% | Alpenglow upgrade coming 🟡 |
| XRP | $1.49 | –55% | –28% | ETF inflows only bright spot 🟢 |
| Dogecoin (DOGE) | $0.11 | –89% | –64% | No use case, no floor 🔴 |
📊 Key Stat: Dogecoin is down 89% from its peak and only about 2,000 businesses worldwide accept it as payment. Meanwhile, XRP ETFs are the only crypto funds consistently pulling in new money during the crash.
The Stablecoin Signal Most People Are Ignoring
Here’s a data point that deserves way more attention than it’s getting.
Stablecoins now make up 82% of all spot crypto trading volume. That’s not just people parking money in Tether while they wait out the storm. That’s an entire financial infrastructure running on crypto rails without anyone really noticing.
Coinbase’s research team projects the stablecoin market cap will hit $1.2 trillion by 2028. For context, the entire crypto market today is about $2.39 trillion. So stablecoins alone could be worth half of what the whole market is worth right now.
Stablecoins didn’t flinch. While Bitcoin lost half its value and altcoins bled out, the one part of crypto that actually works as money kept growing. That tells you more about the future than any price chart.
And this matters for Bitcoin holders because stablecoins create a permanent demand floor for blockchain space. Even if Bitcoin’s price crashes another 50%, the stablecoin ecosystem keeps running. Transactions keep happening. Fees keep getting paid. The network stays alive.
This is a big change from 2022, when the Luna/UST collapse took stablecoins down with everything else. This time around, Tether is actually cooperating with authorities — they helped Turkish law enforcement seize $544 million in frozen assets. Love it or hate it, stablecoins are now part of the real financial system.
🔑 Key Insight: The stablecoin market didn’t shrink during this crash. If anything, it grew. That’s the kind of structural change that doesn’t show up in price charts but matters more than almost anything else for crypto’s long-term future.
What the Experts Think Happens Next
We collected predictions from six major financial institutions and research firms. The range is… wide.
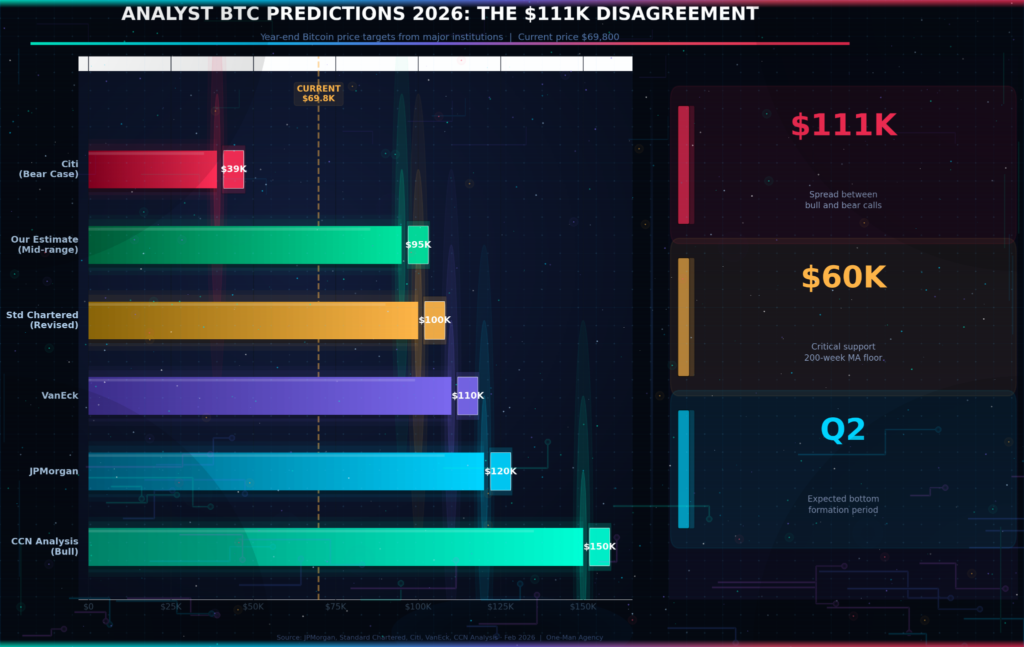
The spread between the most bearish and most bullish call is $111,000. That’s the widest disagreement we’ve ever seen among serious analysts. And it tells you something: nobody actually knows what’s going to happen.
But there are a few things most of them agree on.
The four-year halving cycle is probably still intact. Bitcoin peaked about 18 months after the April 2024 halving, which lines up with what happened in previous cycles. If the pattern holds, 2026 should be a cooling-off year with a bottom forming somewhere in the $50K–$70K range.
Institutions will matter more than retail going forward. JPMorgan’s team made this point clearly — the next leg up won’t come from Reddit threads and YouTube influencers. It’ll come from pension funds, sovereign wealth funds, and corporate treasuries making quiet allocations.
The $60,000 level is the line in the sand. Almost every analyst we looked at pointed to this number as critical support. It lines up with the 200-week moving average, which has historically acted as the “floor” in Bitcoin bear markets. If it breaks, the next stop could be $50,000 or lower. If it holds, that’s probably the bottom.
| Factor | Bull Case | Bear Case |
| Fed policy | Rate cuts boost risk assets | Inflation stays sticky, no cuts |
| ETF flows | Institutional buying returns Q3 | Outflows continue through summer |
| Halving cycle | Bottom forms by Q2, rally Q4 | Extended bear into 2027 |
| Regulation | Clarity Act passes, more ETFs launch | Crackdown on stablecoins |
| BTC year-end | $100K–$150K | $39K–$60K |
Quick Check: How Well Do You Know This Crash?
Before we get to our prediction, test yourself. One of these questions has a trick answer.
🧠 Q1: What was the lowest Fear & Greed Index reading in February 2026? a) 11 · b) 8 · c) 5 · d) 3 ✅ c) 5 — hit on February 6. Lower than COVID (8) and FTX (6).
🧠 Q2: How much Bitcoin actually left ETFs during the 52% price crash? a) 52% of holdings · b) 25% · c) 15% · d) 7% ✅ d) 7% — only 80,000 BTC out of 1.37 million. This is the number most people get wrong. They assume a 52% price drop means half the money ran. It didn’t.
🧠 Q3: Which crypto asset was the ONLY one seeing consistent ETF inflows during the crash? a) Bitcoin · b) Ethereum · c) Solana · d) XRP ✅ d) XRP — quietly pulled in $20 million while everything else bled. Most people guess Bitcoin — but BTC ETFs were net negative for weeks.
🧠 Q4: What is Bitcoin’s estimated production cost as of February 2026? a) $45,000 · b) $77,000 · c) $92,000 · d) $110,000 ✅ b) $77,000 — and with BTC trading below that for most of February, miners are under real stress.
Our Prediction (And What Would Prove It Wrong)
Based on everything we’ve looked at — the PAR metric, the ETF resilience, the stablecoin growth, and the historical cycle data — here’s what we think happens:
Bitcoin finds its bottom between $55,000 and $65,000 in Q2 2026, spends the summer in a boring $60K–$80K range, and finishes the year somewhere between $85,000 and $105,000.
We’re not predicting a new all-time high in 2026. The cycle doesn’t support that. But we think the worst of the selling is close to over — the PAR score of 1.87 tells us this market absorbs fear much faster than it used to, mainly because the buyer base has shifted from retail traders to institutions with longer time horizons.
One caveat about PAR: it measures the speed of the first bounce, not the depth of the final bottom. The COVID crash also bounced fast before grinding sideways for weeks. So a high PAR doesn’t mean the bottom is in — it means the market’s first reaction was healthy. The real test comes in Q2 when we see whether the $60K floor holds under sustained pressure, not just a panic spike. You can track the 200-week moving average yourself on TradingView’s BTC chart — that’s the line everyone is watching.
What would prove us wrong? Two things:
- If Bitcoin breaks below $55,000 and stays there for more than two weeks, the four-year cycle thesis is probably dead, and we’d have to rethink everything.
- If ETF outflows speed up past $2 billion per month through Q2, it means institutions are giving up — not buying the dip.
We’ll check back on both of these by June 2026.
⏱️ Timestamped checkpoint: On February 14, 2026, at 8:32 PM UTC, Bitcoin traded at $69,797. Ethereum at $2,084. Fear & Greed Index at 8. Set a reminder. Come back in 90 days. See where we land.
📌 Reader Homework: Go to alternative.me/crypto/fear-and-greed-index and bookmark it. Check the number once a week. Every time this index has stayed below 10 for more than five days, Bitcoin was higher 12 months later. Every single time. That streak is now being tested again.
Sources: CoinDesk, CNBC, CoinMarketCap, Yahoo Finance, SoSoValue, Seeking Alpha, Coinbase Institutional Research, JPMorgan, Standard Chartered, CCN Analysis, Farside Investors, Alternative.me. All data as of February 14, 2026.
This article is for informational purposes only and should not be treated as financial advice. Cryptocurrency markets are extremely volatile and you can lose your entire investment. Always do your own research before making any decisions.